This post is part of a small series of non-university studies (guest posts from enlightened amateurs) on Roumazeilles.net. So, we sometimes welcome a few authors whose works may be of a wider interest or simply original.
The work below has been written by Marion Jonchères, in November 2020.
Yves Roumazeilles
1. Introduction: Business understanding, target audience
Before Covid-19, tourists used to travel all over the world very easily. In a post-Covid environment, they will hopefully be able to resume traveling. They may however have different expectations and change the way they travel. Maybe they will no more rush to foreign cities, spend a few days running from one interest point to another and come back? Maybe they will take time to relax, enjoy, listen to birds and breathe cleaner air in gardens, parks and trails? Wouldn’t it be nice for a travel agency to be able to recommend a city trip based on what their clients truly expect?
With a bit of data science, travel agencies can get an overview of what some well-known European cities have to offer to visitors. These cities are famous for their historical buildings and their shopping streets, but what can they also offer to their clients in terms of ‘ecotourism’ or ‘green travel’? We’ll try to compare them so that travel agencies can recommend the right trip to their clients, depending on their wishes. And, once they decide, the travel agencies would be able to deliver maps of the chosen city with recommendation of where to go depending on what visitors want to experience.
Let’s have a look at two cities in Southern Europe (Rome and Barcelona) and two cities a few degrees further North (Paris and London). These cities are amongst the top destinations for tourism in Europe, with London ranking 1st, Paris 2nd, Rome 5th and Barcelona 8th (source: Statista, 2018 data).
2. Data strategy
We quickly notice that cities are very different in size from one another. As we assume most tourists are interested in spending time between cultural locations, shopping tours, sightseeing, exploring museums or getting fresh air in green spaces, we chose to focus on the most active and richest part of cities i.e. downtown areas. This will lead us to scan the Inner London (330 km2 already, as opposed to Greater London which is more like 1600km2!) and Paris ‘intra-muros’ (meaning without suburbs, for a total of c. 87 km2). Barcelona is similar to Paris in size whereas Rome is much larger (c. 1300km2) and we’ll have to stick to central districts.
As far as Paris is concerned, we include the two public parks respectively West and East of the central city. These parks are actually owned by Paris city but are often excluded from statistics as nobody lives there.
Our primary purpose being a comparative analysis, we chose to stick to the borough level and not adopt a thinner split. A thinner split would have given a better analysis of each city on its own, but might have given too many details and no trend in a comparative exercise.
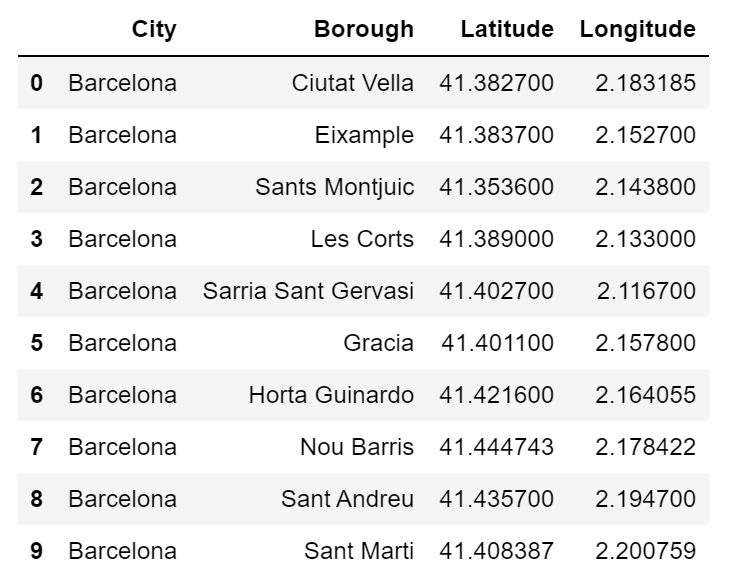
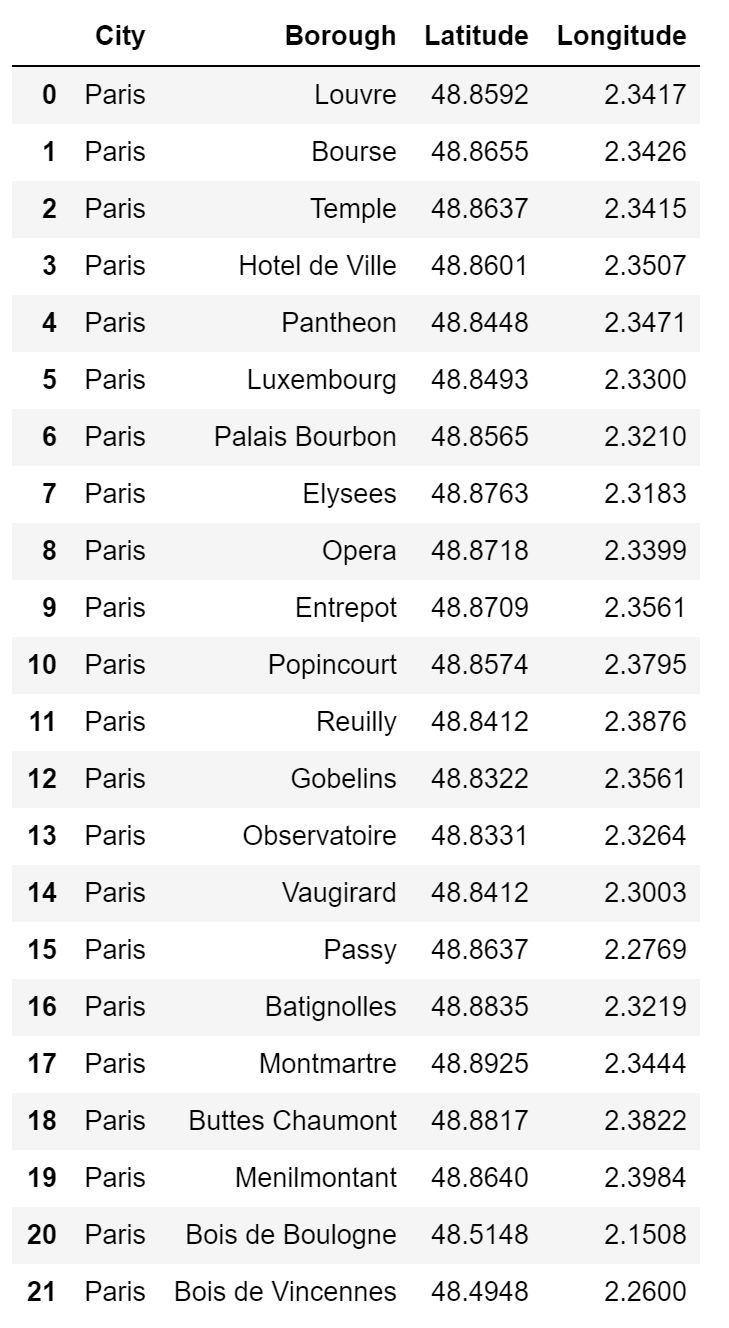
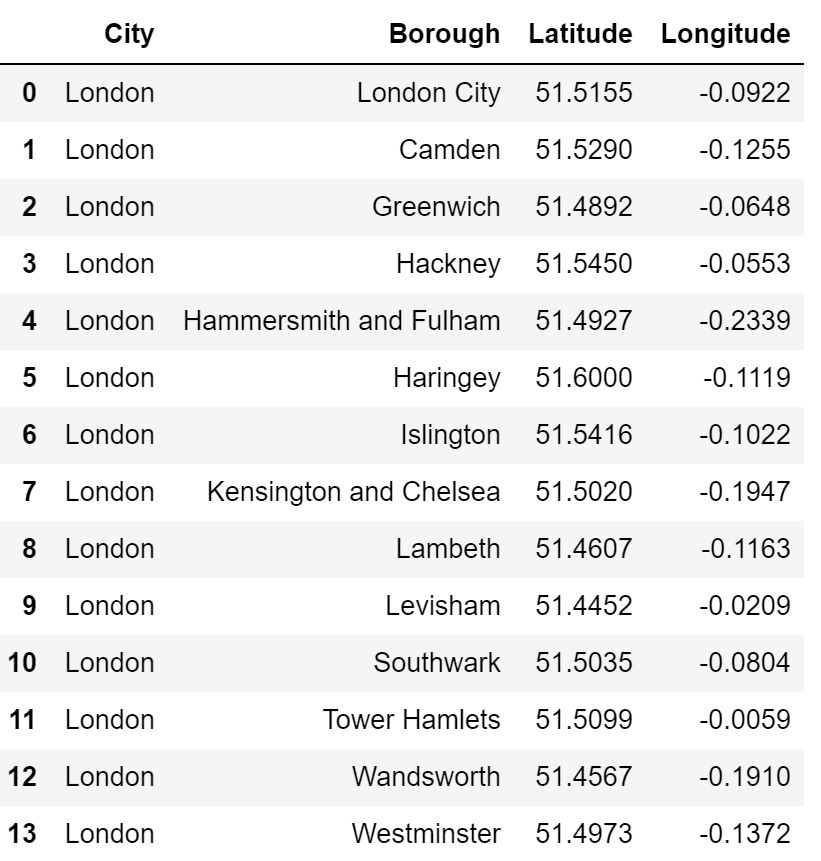
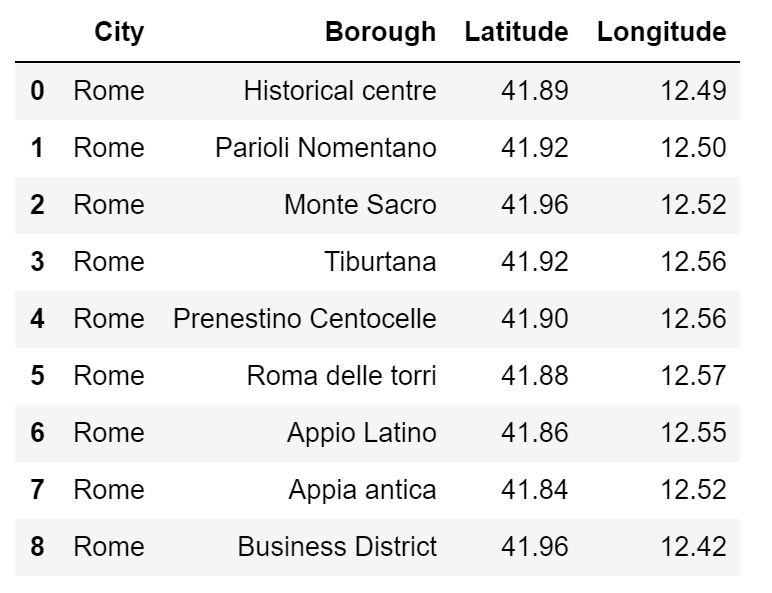
Data is available from different websites. Wikipedia provides the list of their boroughs. We can find GPS coordinates with Geocoder. We can start working on the four databases we come up with, one per city (table 1).
 |  |
 |  |
For each city, we then retrieve FourSquare data relative to venues. Using Four Square clearly limits the view we’ll have of what is available in the city:
- FourSquare does not scan all available venues: It’s not a phone book!
- FourSquare does not scan venues in different cities in a consistent manner, depending on whether the application exists in the local language, whether FourSquare members usually travel there or not. As FourSquare is an American company, it probably has more venues in North America than in Europe. When comparing cities, we will be vigilant and weigh the number of venues vs. total of available venues for each city.
However, the advantage of FourSquare is that posted venues will be open to most and will also be suitable for visitors.
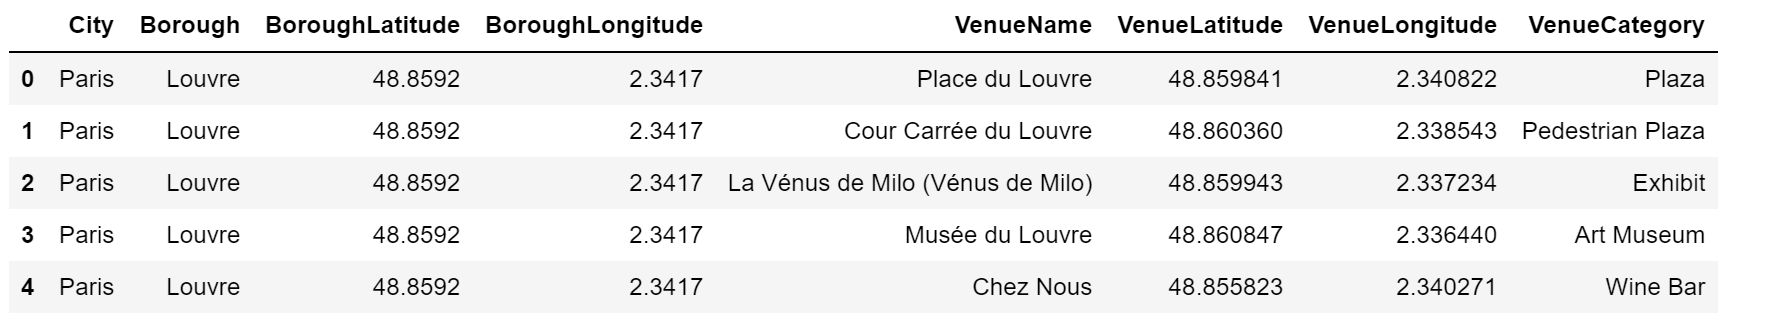
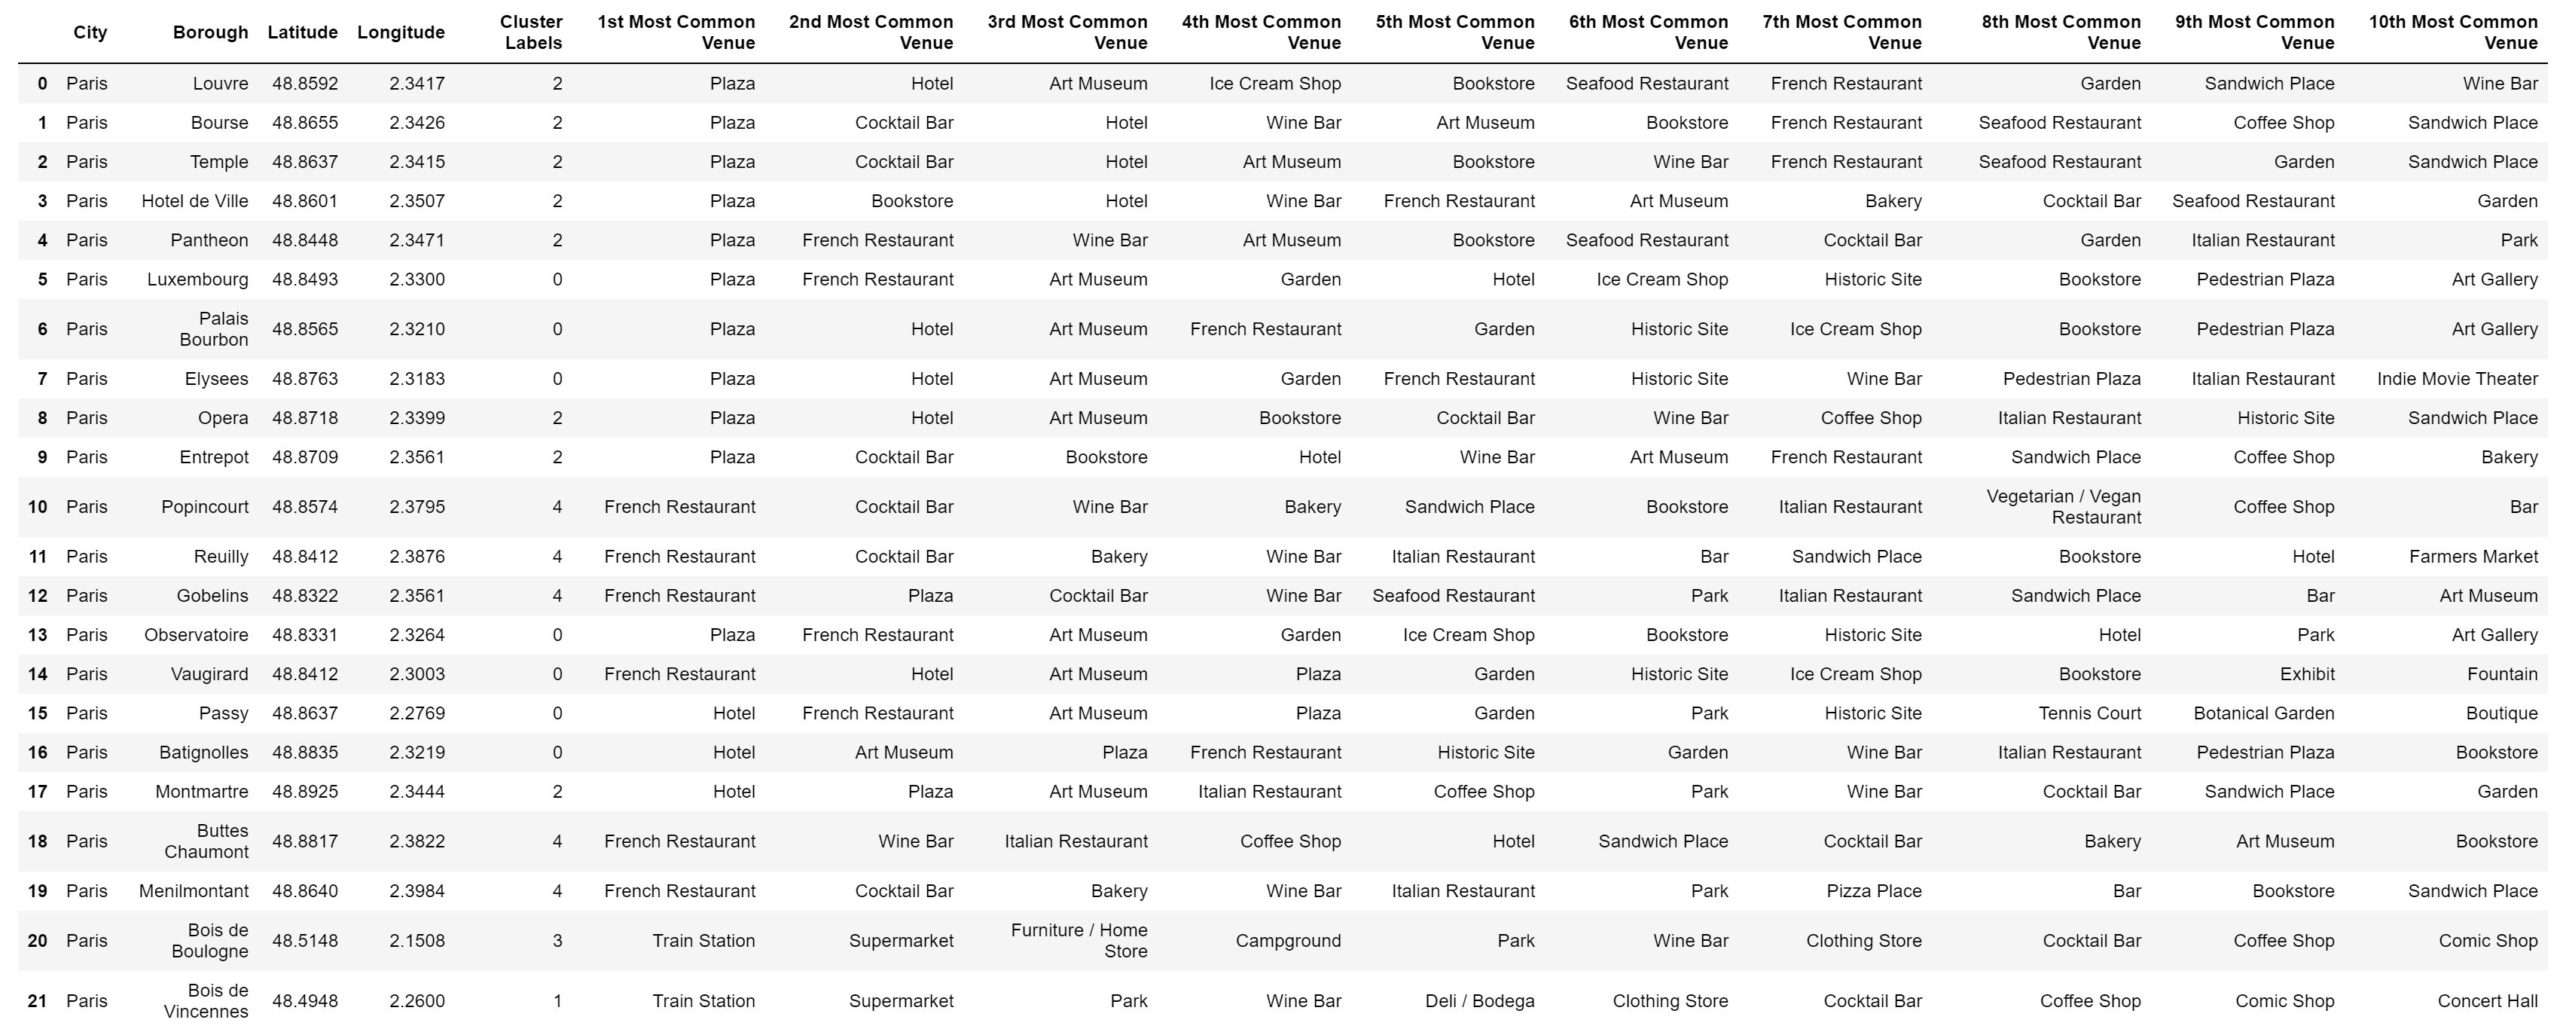
We end up this data acquisition phase with four new databases including FourSquare venues, like the Paris one below (5 first rows only):
At some point, we have decided to 1/ not pay too much attention to hotels, coffee shops… which are fairly common in all touristic destinations, and 2/ regroup several venues under different themes, for simplification purpose and for a better understanding of the final results, e.g.:
- HISTORY regroups historic sites, monuments / landmarks, plazas, churches, fountains;
- CULTURAL LIFE includes art museums, art galleries, theaters, concert halls, bookstores;
- GASTRONOMY is an elegant name for… local specialty food or drink, e.g. tapas restaurant in Barcelona, wine bar in Paris, pub / beer bar in London;
- ECOTOURISM is based on number of parks, gardens, trails.
3. Methodology
We have proceeded in two steps: First, a city-by-city analysis (one after another) with the same stages for each; and, second, an analysis of a merged database to make comparisons. Please, note that all results are presented in the chapter 4.
3.1. City-by-city analysis
We first looked at what venues were the most widely available in the city based on all venues retrieved from FourSquare (as seen in table 2 supra).
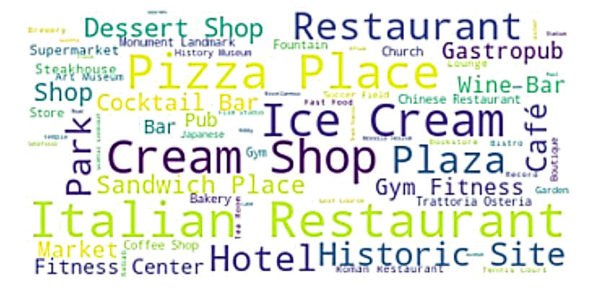
- WordCloud analysis: We extracted text from the VenueCategory column and applied the
word_cloudpackage. As bigger and bolder words being the more preeminent in the text, this means these venues are amongst the most common;
- Counting / getting the occurrence of each individual venue. We quickly pointed out a few very common venues, often quite different from one city to another. We managed to visualize this with Matplotlib bar charts.
Then, we looked at what venues were the appreciated most in the city.
- We sorted out the database to get the 10 most common venues per borough.
- In some cases, the most common / i.e. appreciated venues were not the most widely available.
We afterwards tried to find out whether boroughs were similar or not, and what this similarity consisted of. We then performed a clustering analysis with KMeans.
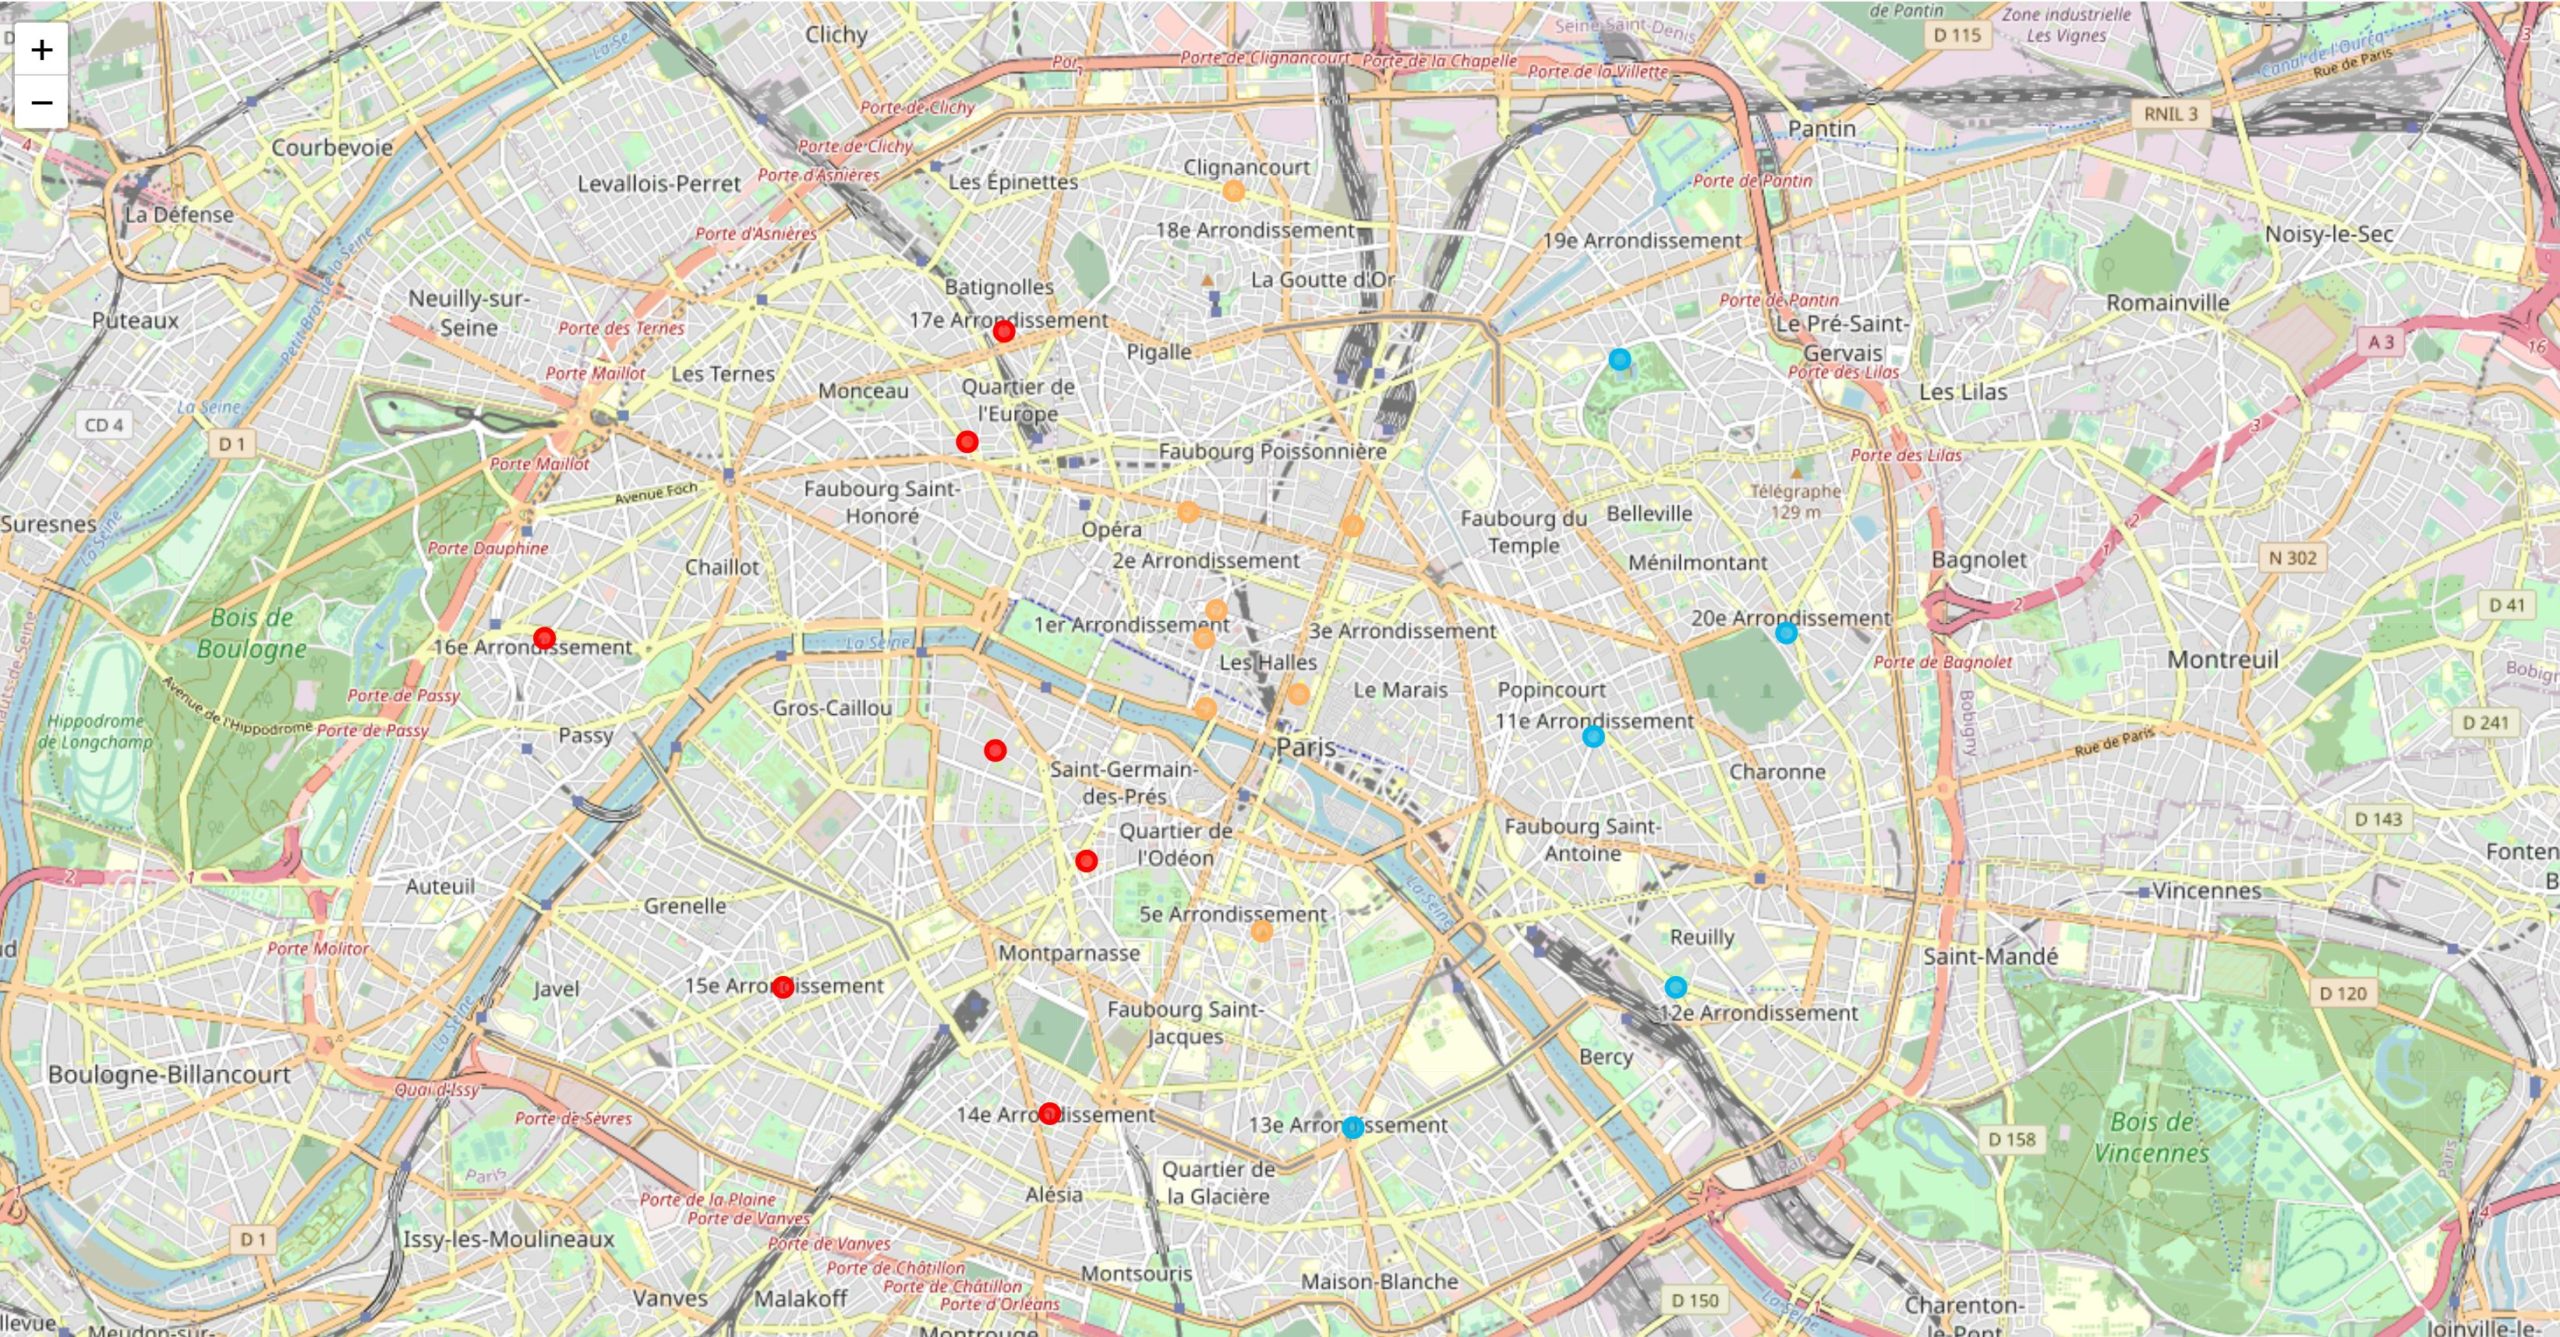
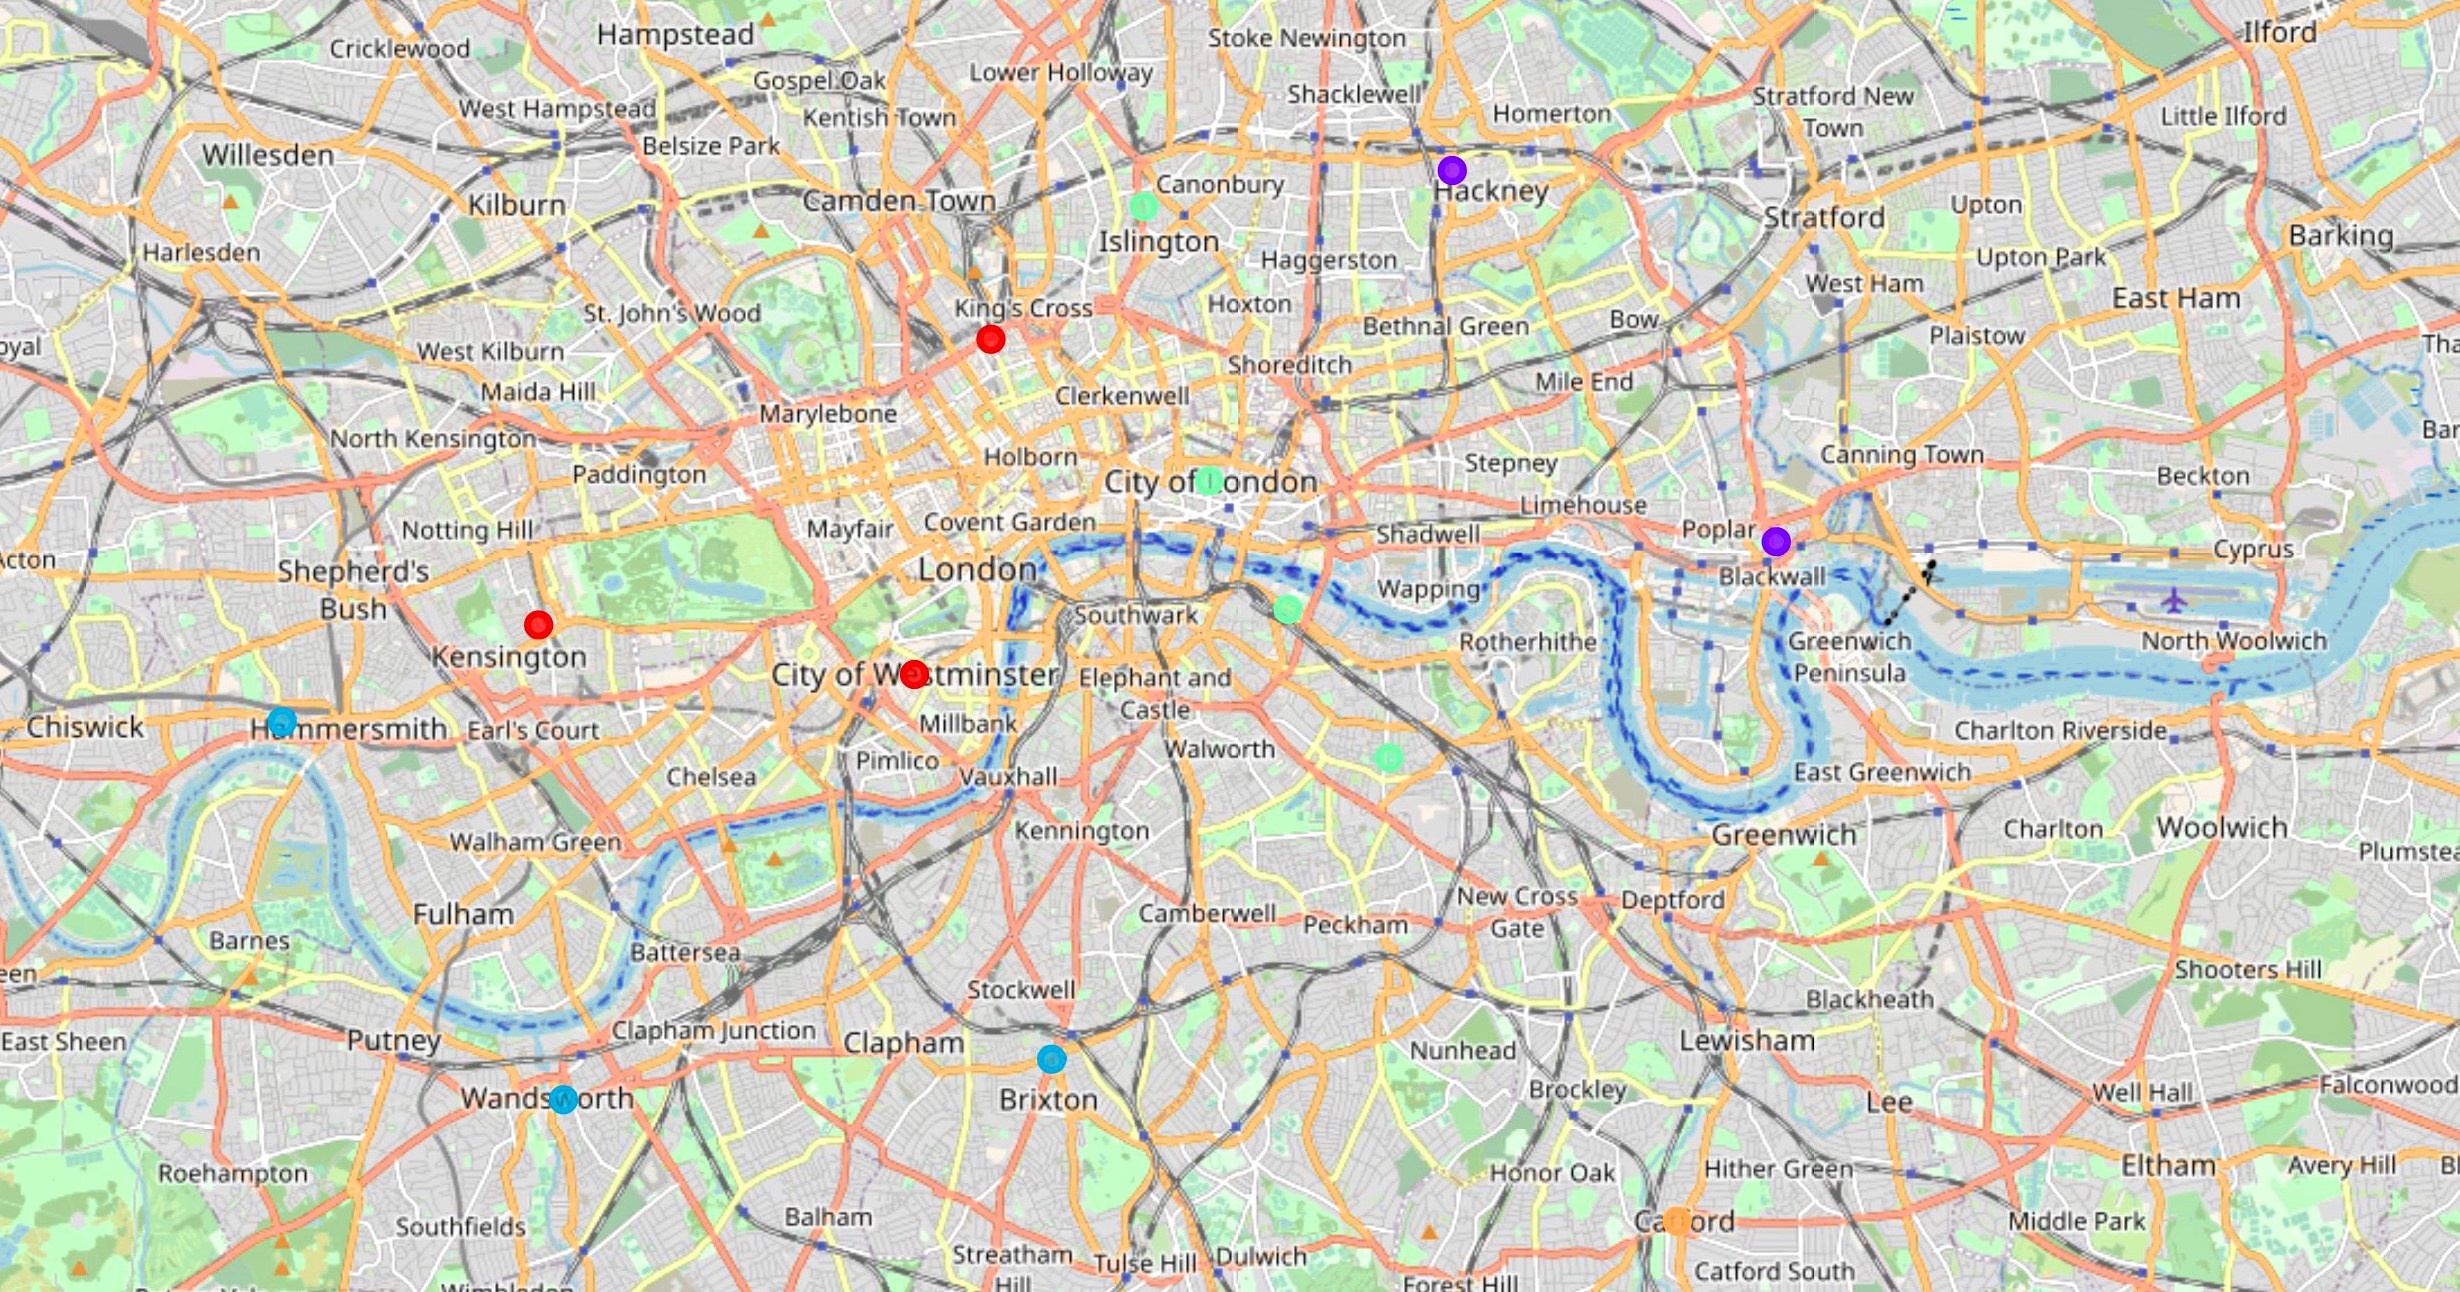
Eventually, we use Folium maps to better show the clusters.
3.2. Merged analysis
We conducted another clustering analysis on the merged dataframe, to see whether there were boroughs from different cities in a same cluster. For example, if a client wants to visit historic sites, will the travel agent be able to tell him/her: “Yes for sure! You can go to such borough in Rome, or to the borough X in Barcelona”.
We finally weighted the most common venues vs. total venues for each city (previously gathered under the four themes mentioned supra – History, gastronomy, cultural life, ecotourism) and compared the four cities with a Matplotlib bar chart. This will allow the travel agent to tell his client: “You should probably prefer Paris (borough Y) because this is the city for history lovers!”
4. Results
4.1. ROME
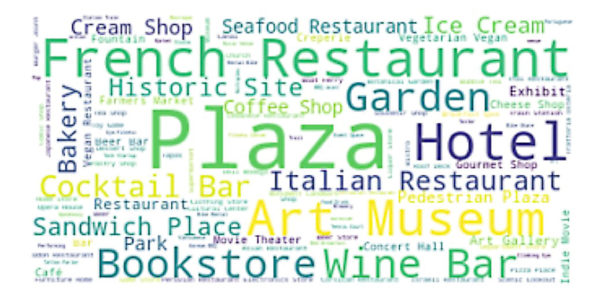
Rome’s most widely available venues can be visualized as follows:
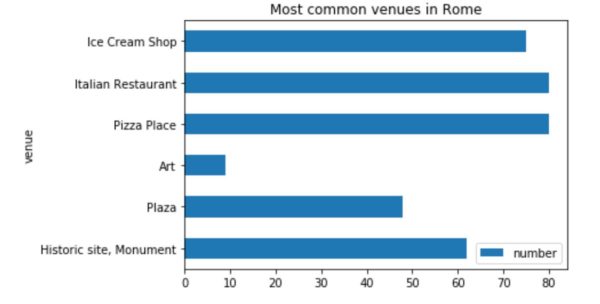
Rome’s most common venues can also be visualized as follows:
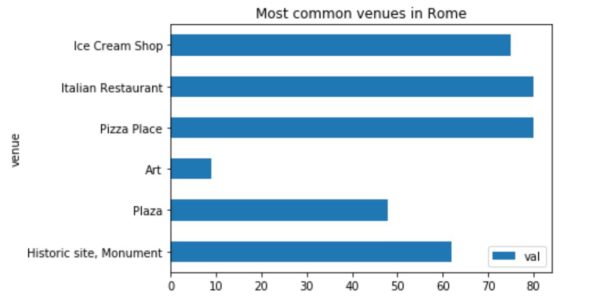
Ranking of available venues is confirmed by preferred venues with gastronomy coming up as the most popular activity in 2/3 of the boroughs:
- In 6 out of 9 boroughs, at least 2 out of the 3 top venues are ice-cream shops or pizza places / Italian restaurants.
- Rome ice-creams must be some of the best in Europe as ice-cream shops are amongst the top 5 venues in all but one borough, and the top venue in 2 boroughs! Or is it because it is a rather hot city?
- Pizzas come as the second preferred dish.
Ecotourism is very limited, with a park between the 3rd and the 10th most common venues in 7 out of the 9 boroughs.
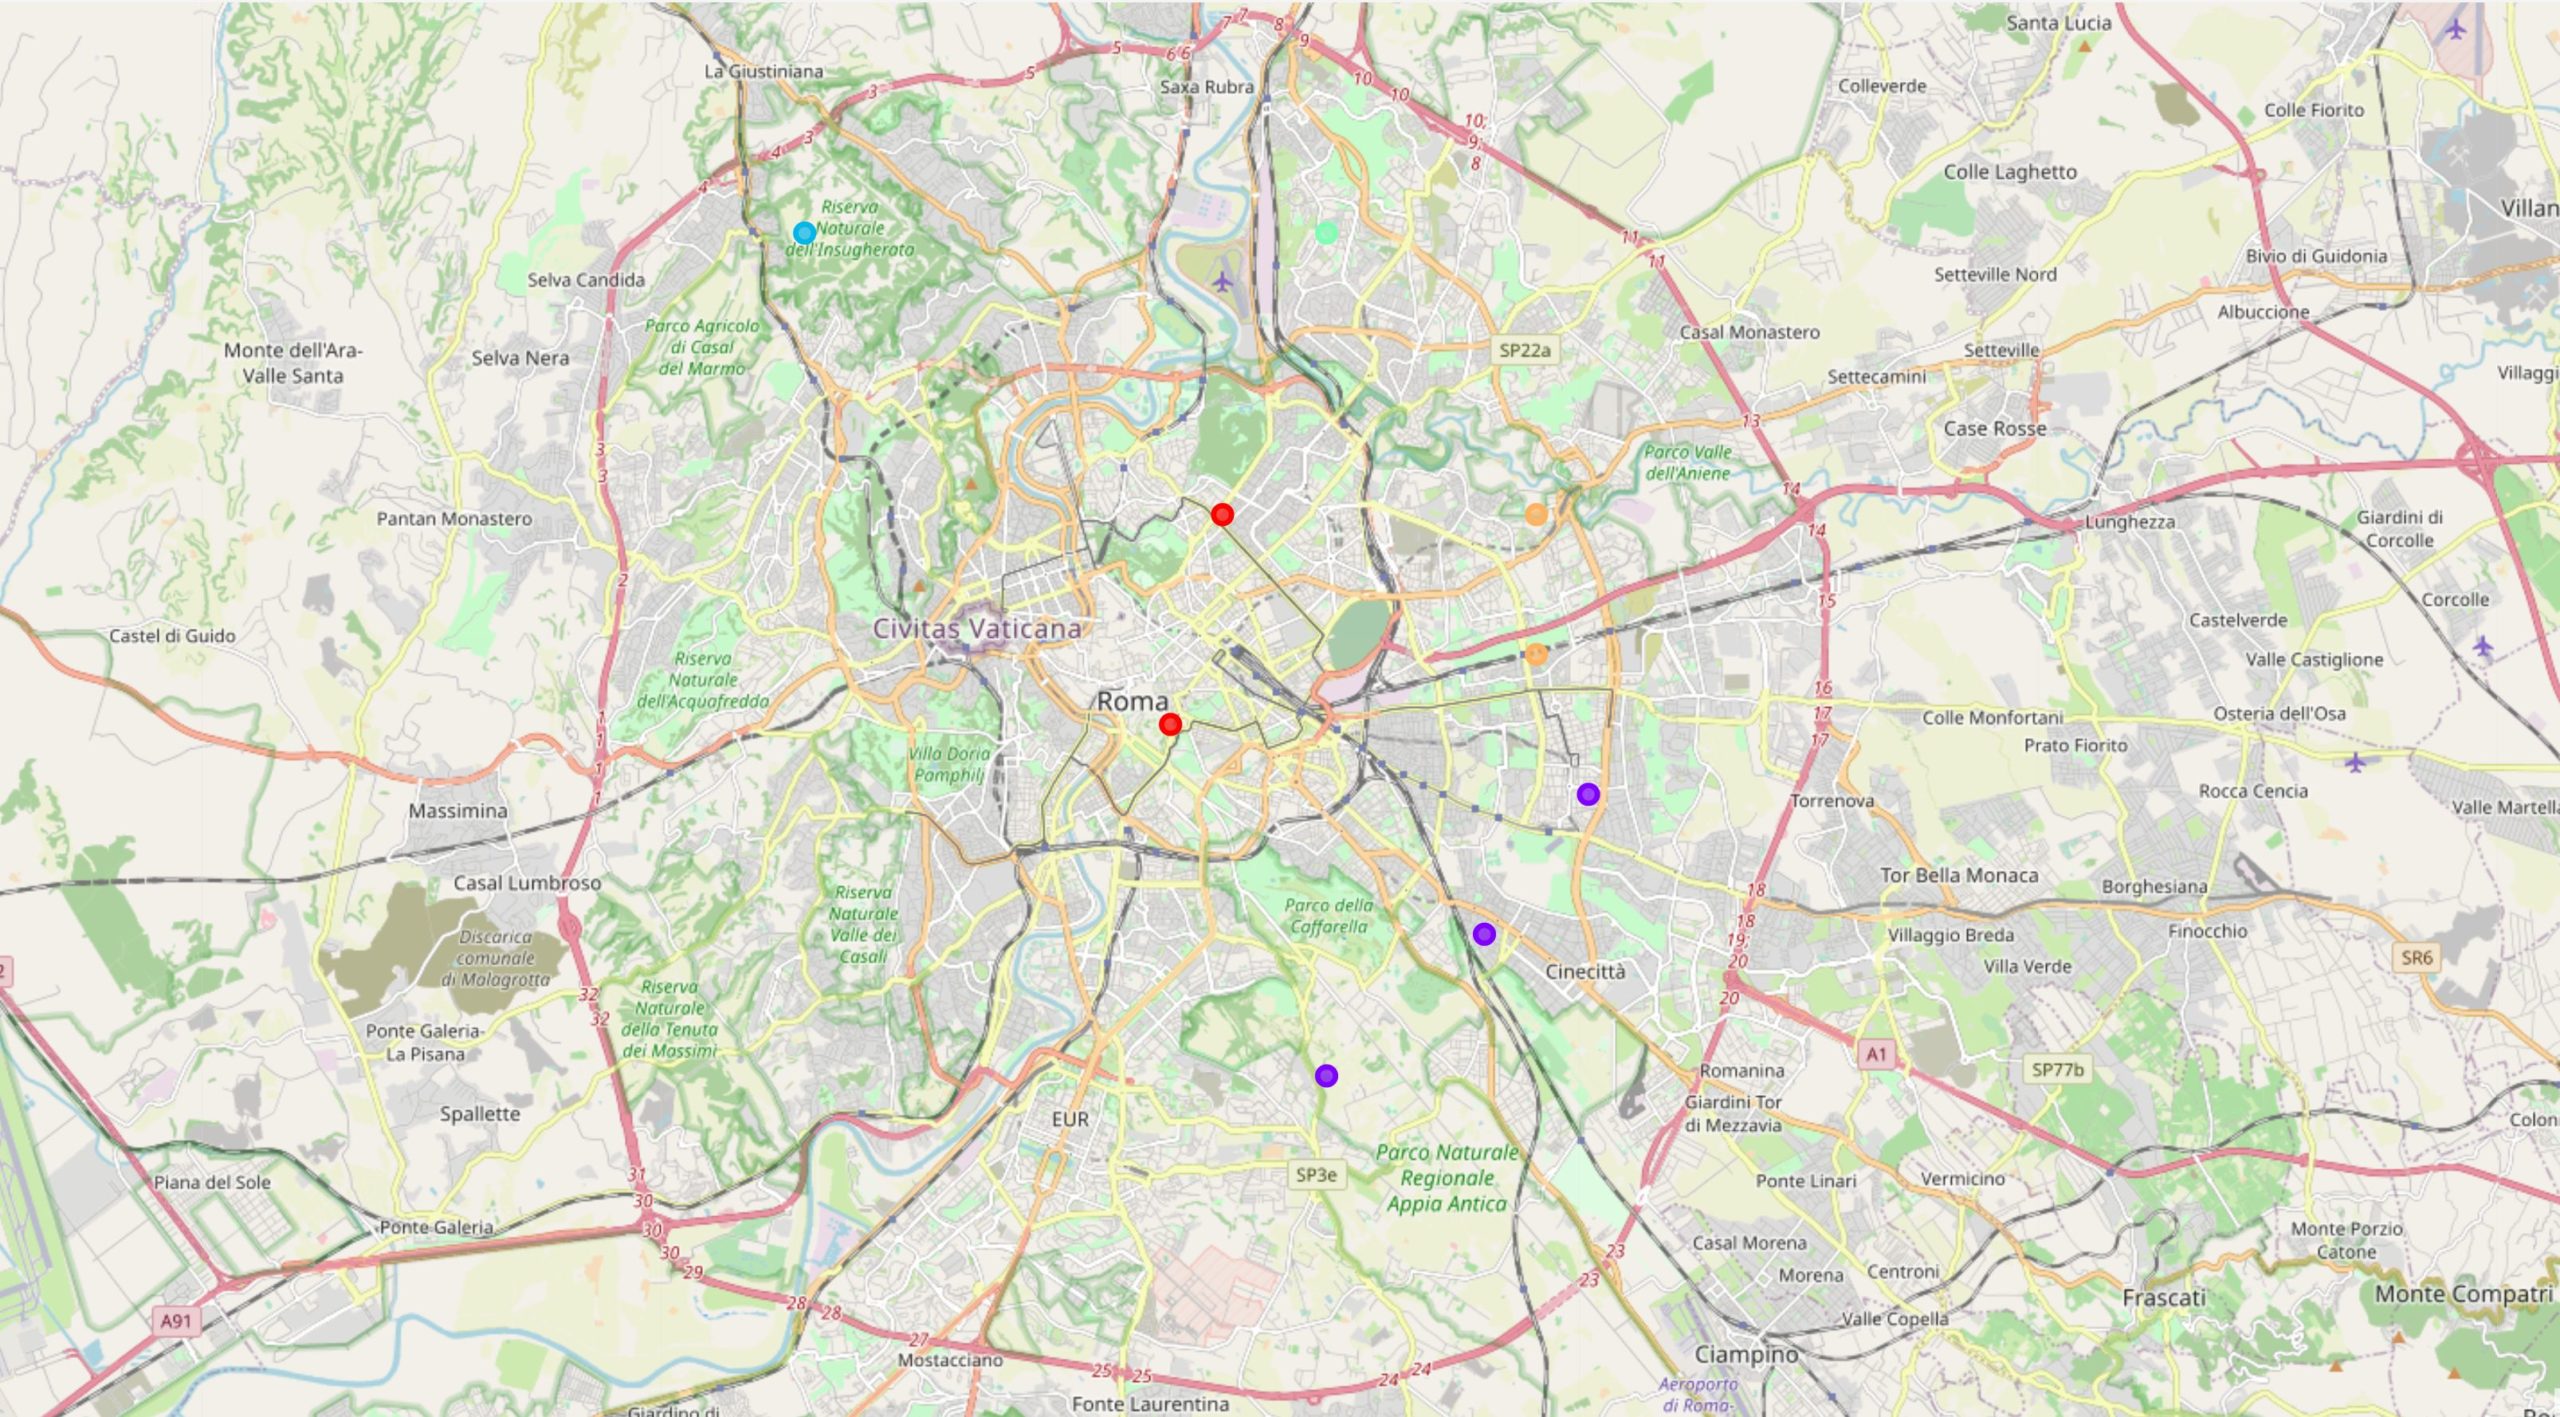
If you go to Rome, don’t miss monuments / landmarks: Rome is a great city for History lovers to hang around. Go to Historical centre or Parioli Nomentano (in red cluster 0 below), where 6 to 7 amongst the 10 most common venues are historical sites.
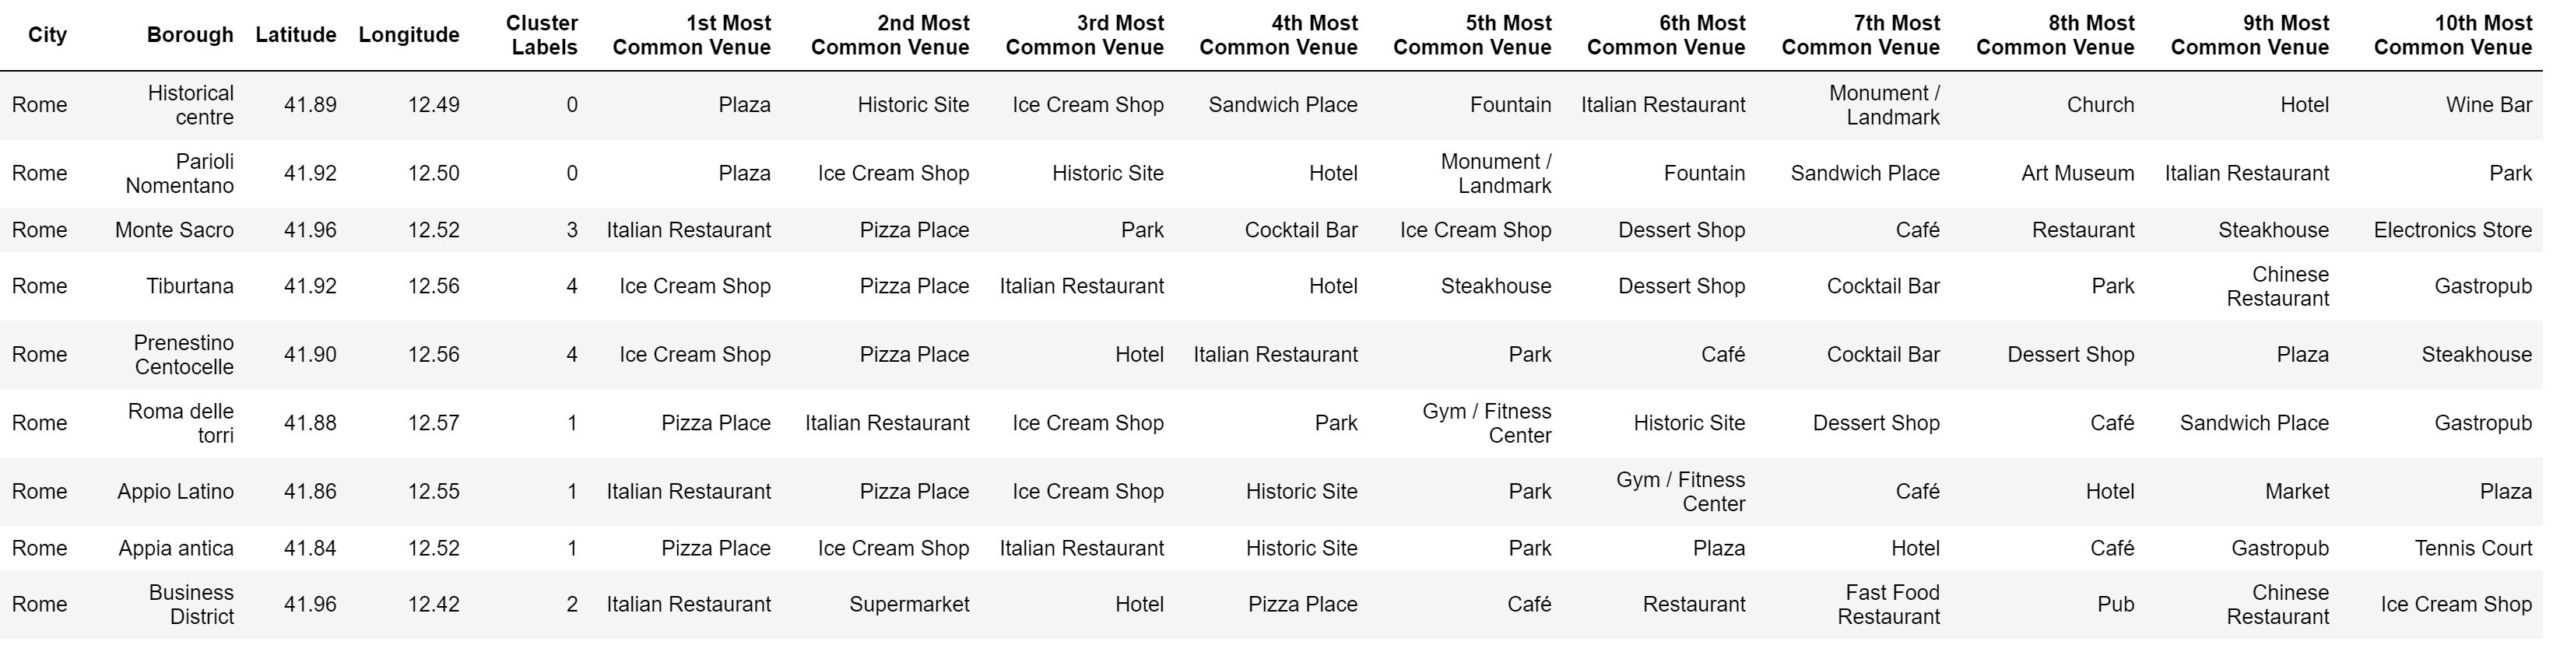
Monte Sacro (light green on the map below, North East of the city) is probably the place to eat or have a cup of coffee; there is little visiting there but a pleasant park (3rd most common venue) to get a rest while sipping an ice-cream.
Boroughs of cluster 1 (in purple below, south-east of the city) is probably the living area for residents with venues like tennis courts or gyms.
4.2. PARIS
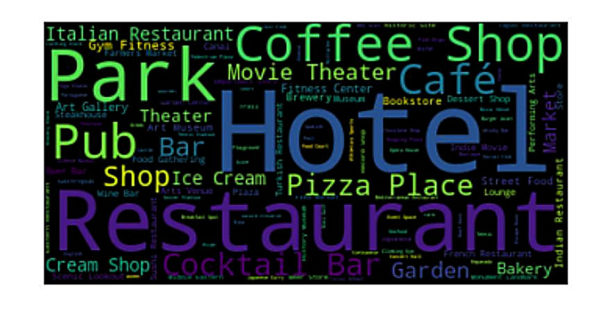
Paris’ most widely available venues can be visualized as follows:
Paris’ most common venues can also be visualized as follows:
Paris is another great destination for history lovers with plenty of plazas, historic sites and some monuments. Second available venue category is cultural life (art galleries and museums, bookstores) while gastronomy is also widely available (meaning French restaurants & wine bars). No wonder, as the country as a whole is famous worldwide for its cuisine and its wine.
The analysis of most common venues vs. all available venues emphasizes the specificities of the city: Visitors plebiscite history, cultural and gastronomy venues.
Clusters 0 and 2 seem pretty close as areas for tourists with hotels / plazas / art museums and bookstores as preferred venues, meaning history and cultural life. The two themes are however widely spread in pretty much all the city: even if we requested 5 clusters, the whole city (excluding the two woods) is split into three clusters only. Cluster 1 and 3, with only one borough in each, are pretty close as well as including the large public parks, train station and supermarket: This is the ‘greenest’ part of Paris. Cluster 4 in blue is more related to restaurants, cocktail bars and coffee shops.
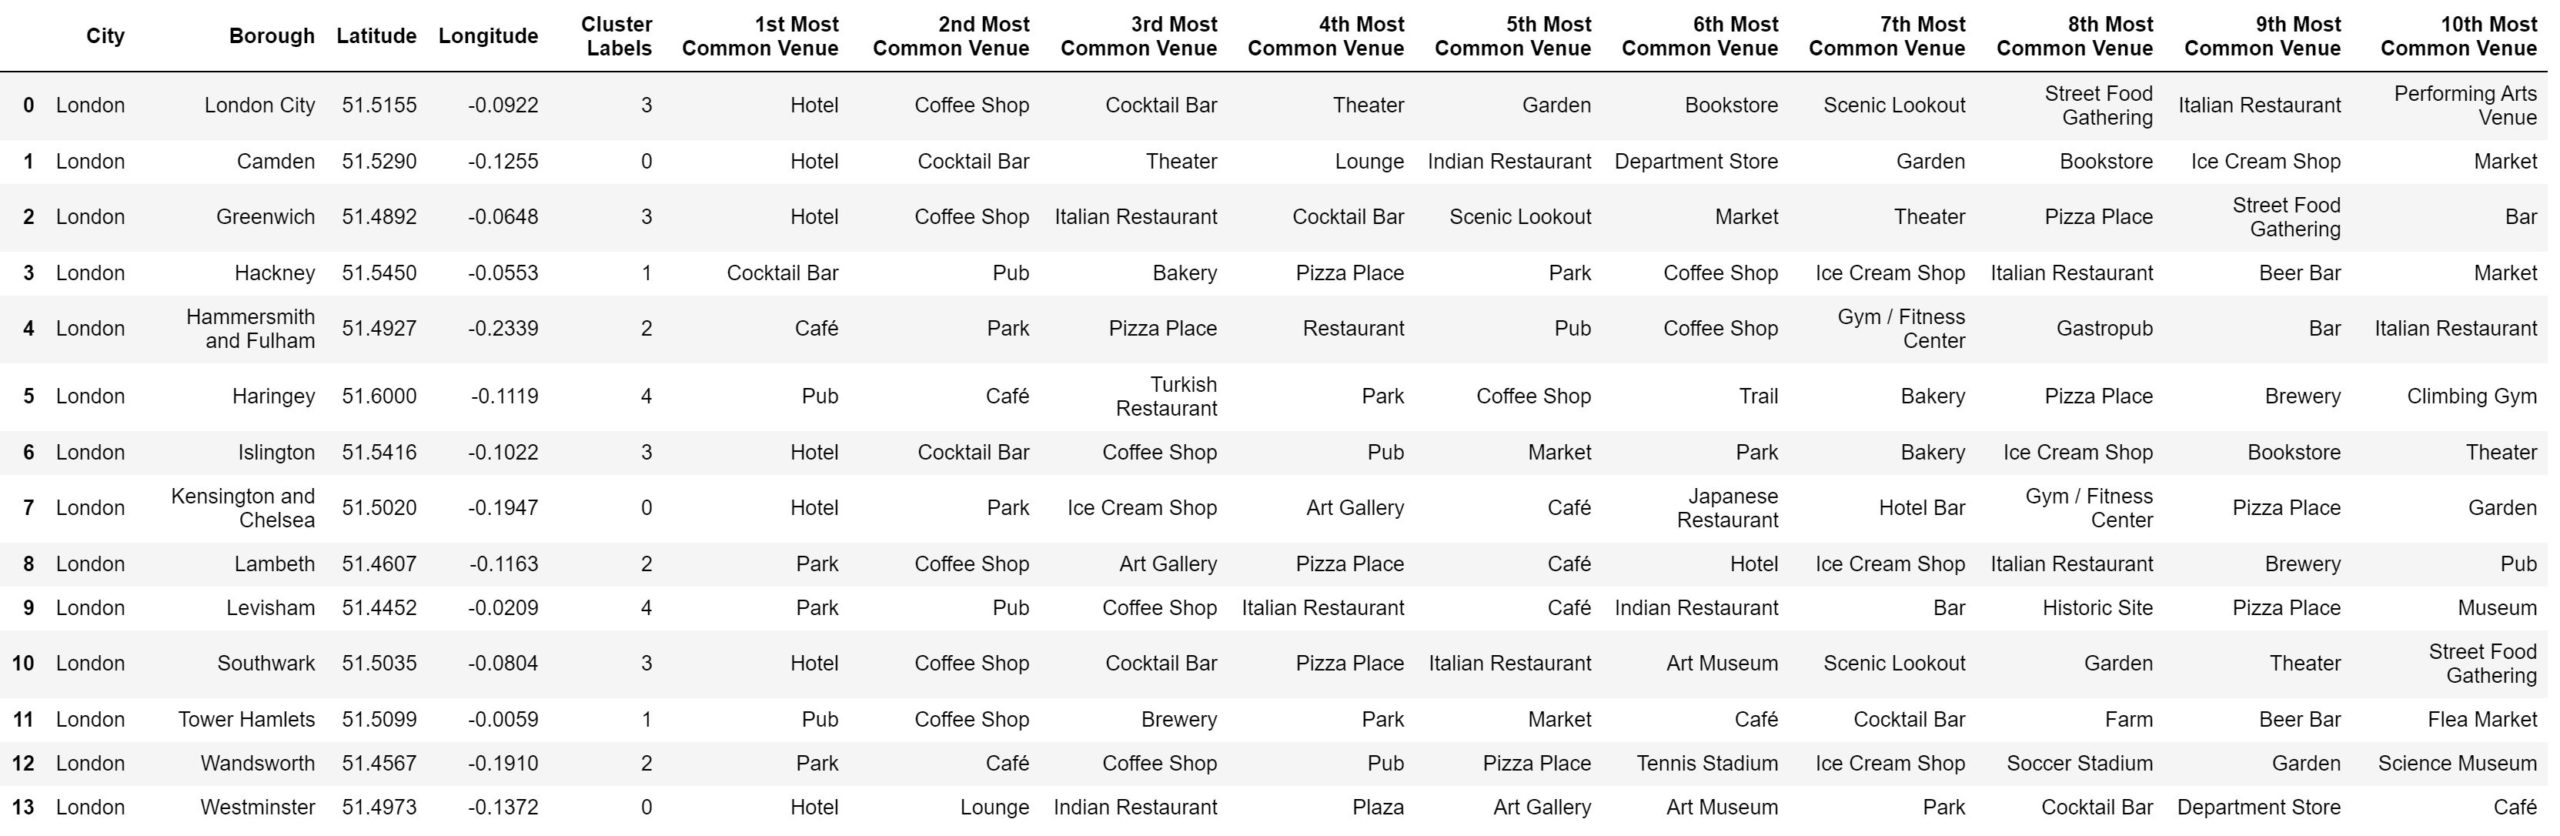
4.3. LONDON
London’s most widely available venues can be visualized as follows:
London’s most common venues can also be visualized as follows:
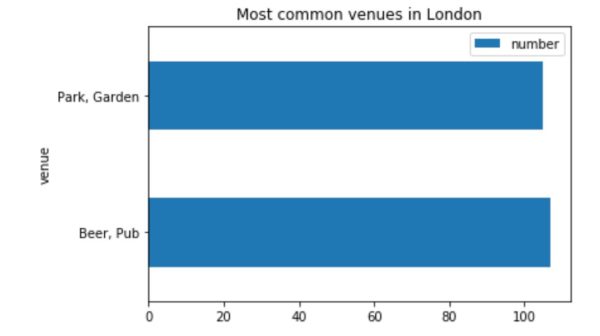
London seems to be a more diversified city with only two venues emerging as much more widely available than others: Ecotourism (parks, gardens) and beer-related economy (brewery, beer bars, pubs)! We are tempted to say that there is no gastronomy per se in London, and visitors ignore specific dishes or English cooking tradition; FourSquare does not report “English restaurants”, but the city is clearly open to foreign cooking e.g. Indian restaurants, Italian restaurants or Asian-style foodstores. Cultural life is somewhat present with art galleries and theaters, plus some bookstores.
Cluster 2 (light blue on the map below) seems to be the greenest part of London, together with cluster 4 ( orange bubbles below) which is also a good place for drinking bear in a pub, as is cluster 1 (purple bubbles below). There is no striking difference between the other clusters.
4.4. BARCELONA
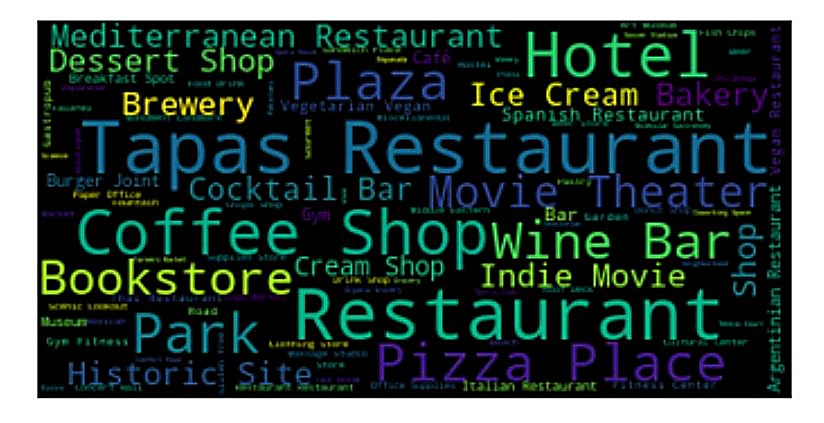
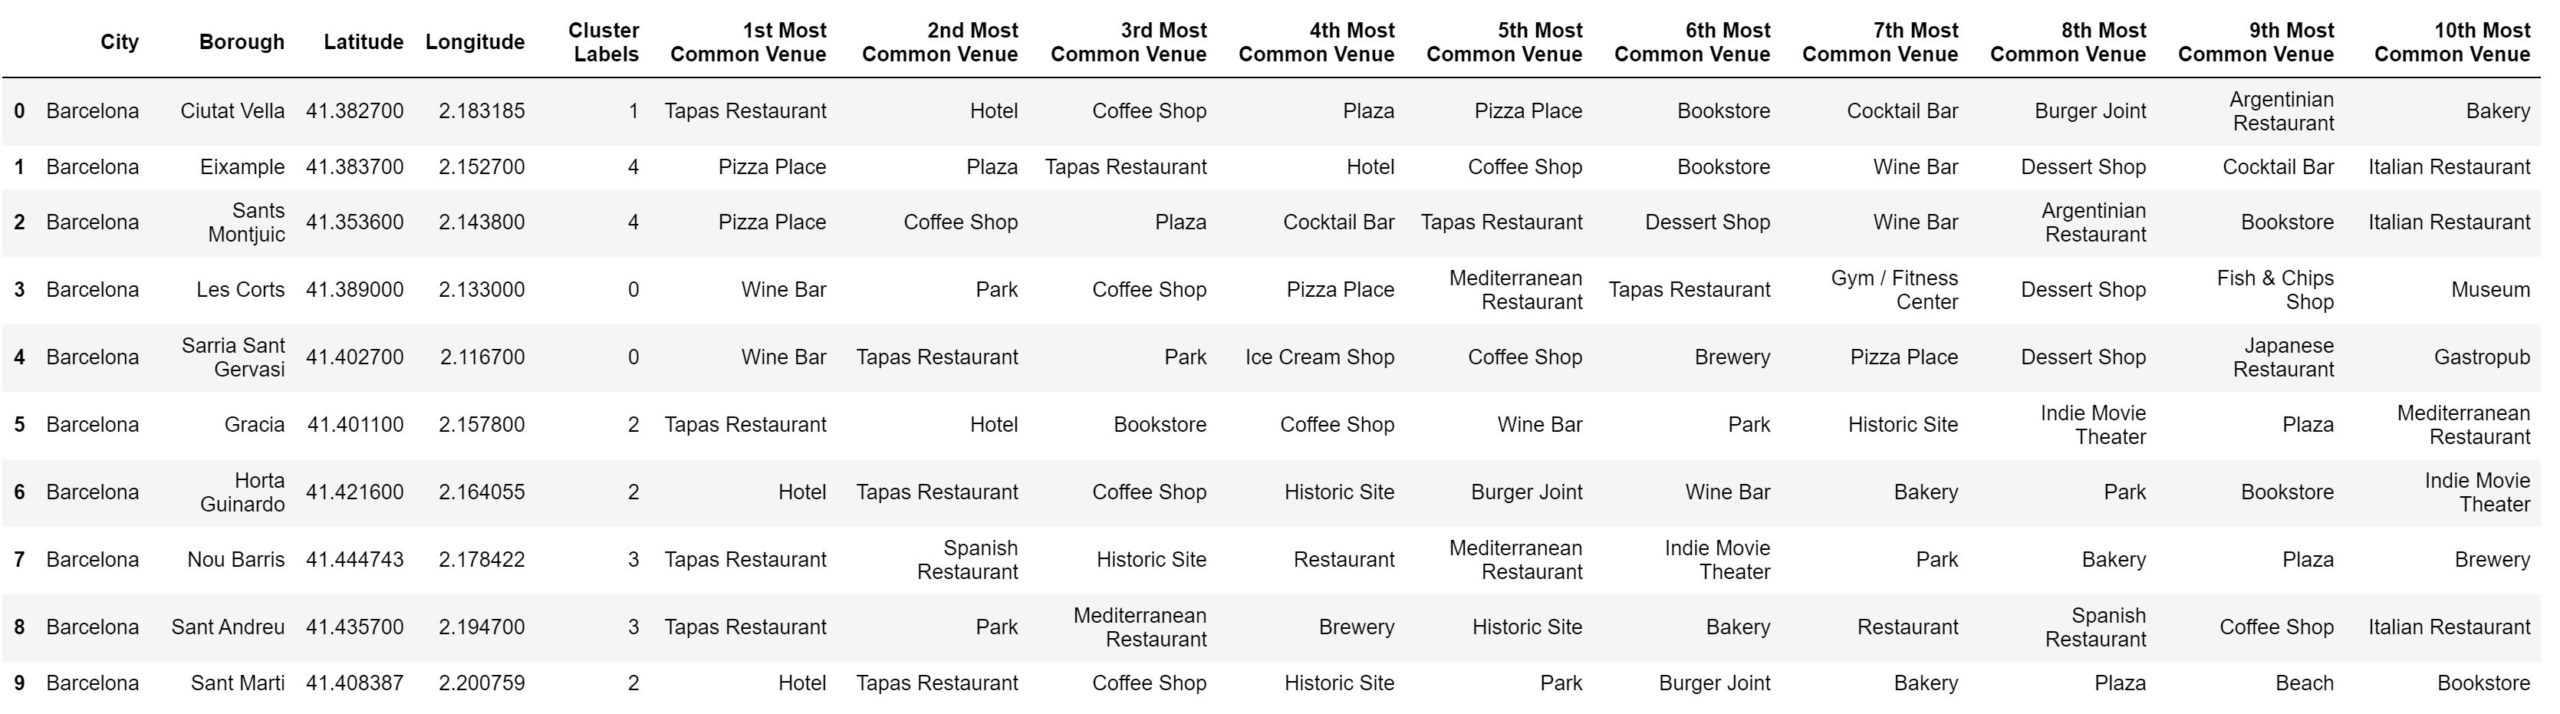
Barcelona’s most widely available venues can be visualized as follows:
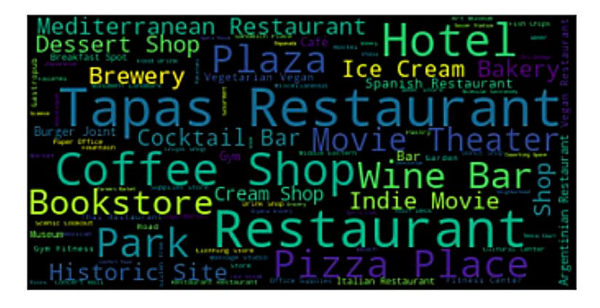
Barcelona’s most common venues can also be visualized as follows:
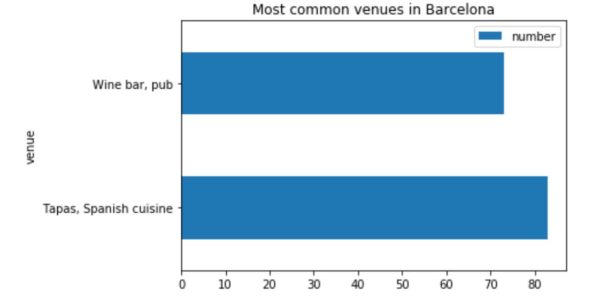
History is somewhat present with lots of plazas and some historic sites, spread all over the city, but the most widely available activity in Barcelona relates to gastronomy, namely tapas and wine bars / pubs. This is also definitely the most common / the most preferred as tapas / Spanish restaurants come as the preferred activity in half of the boroughs (and second in four other boroughs), whereas wine bars come as most preferred activity in two boroughs.
Ecotourism is about the same as in Rome, with some green areas spread all over the city.
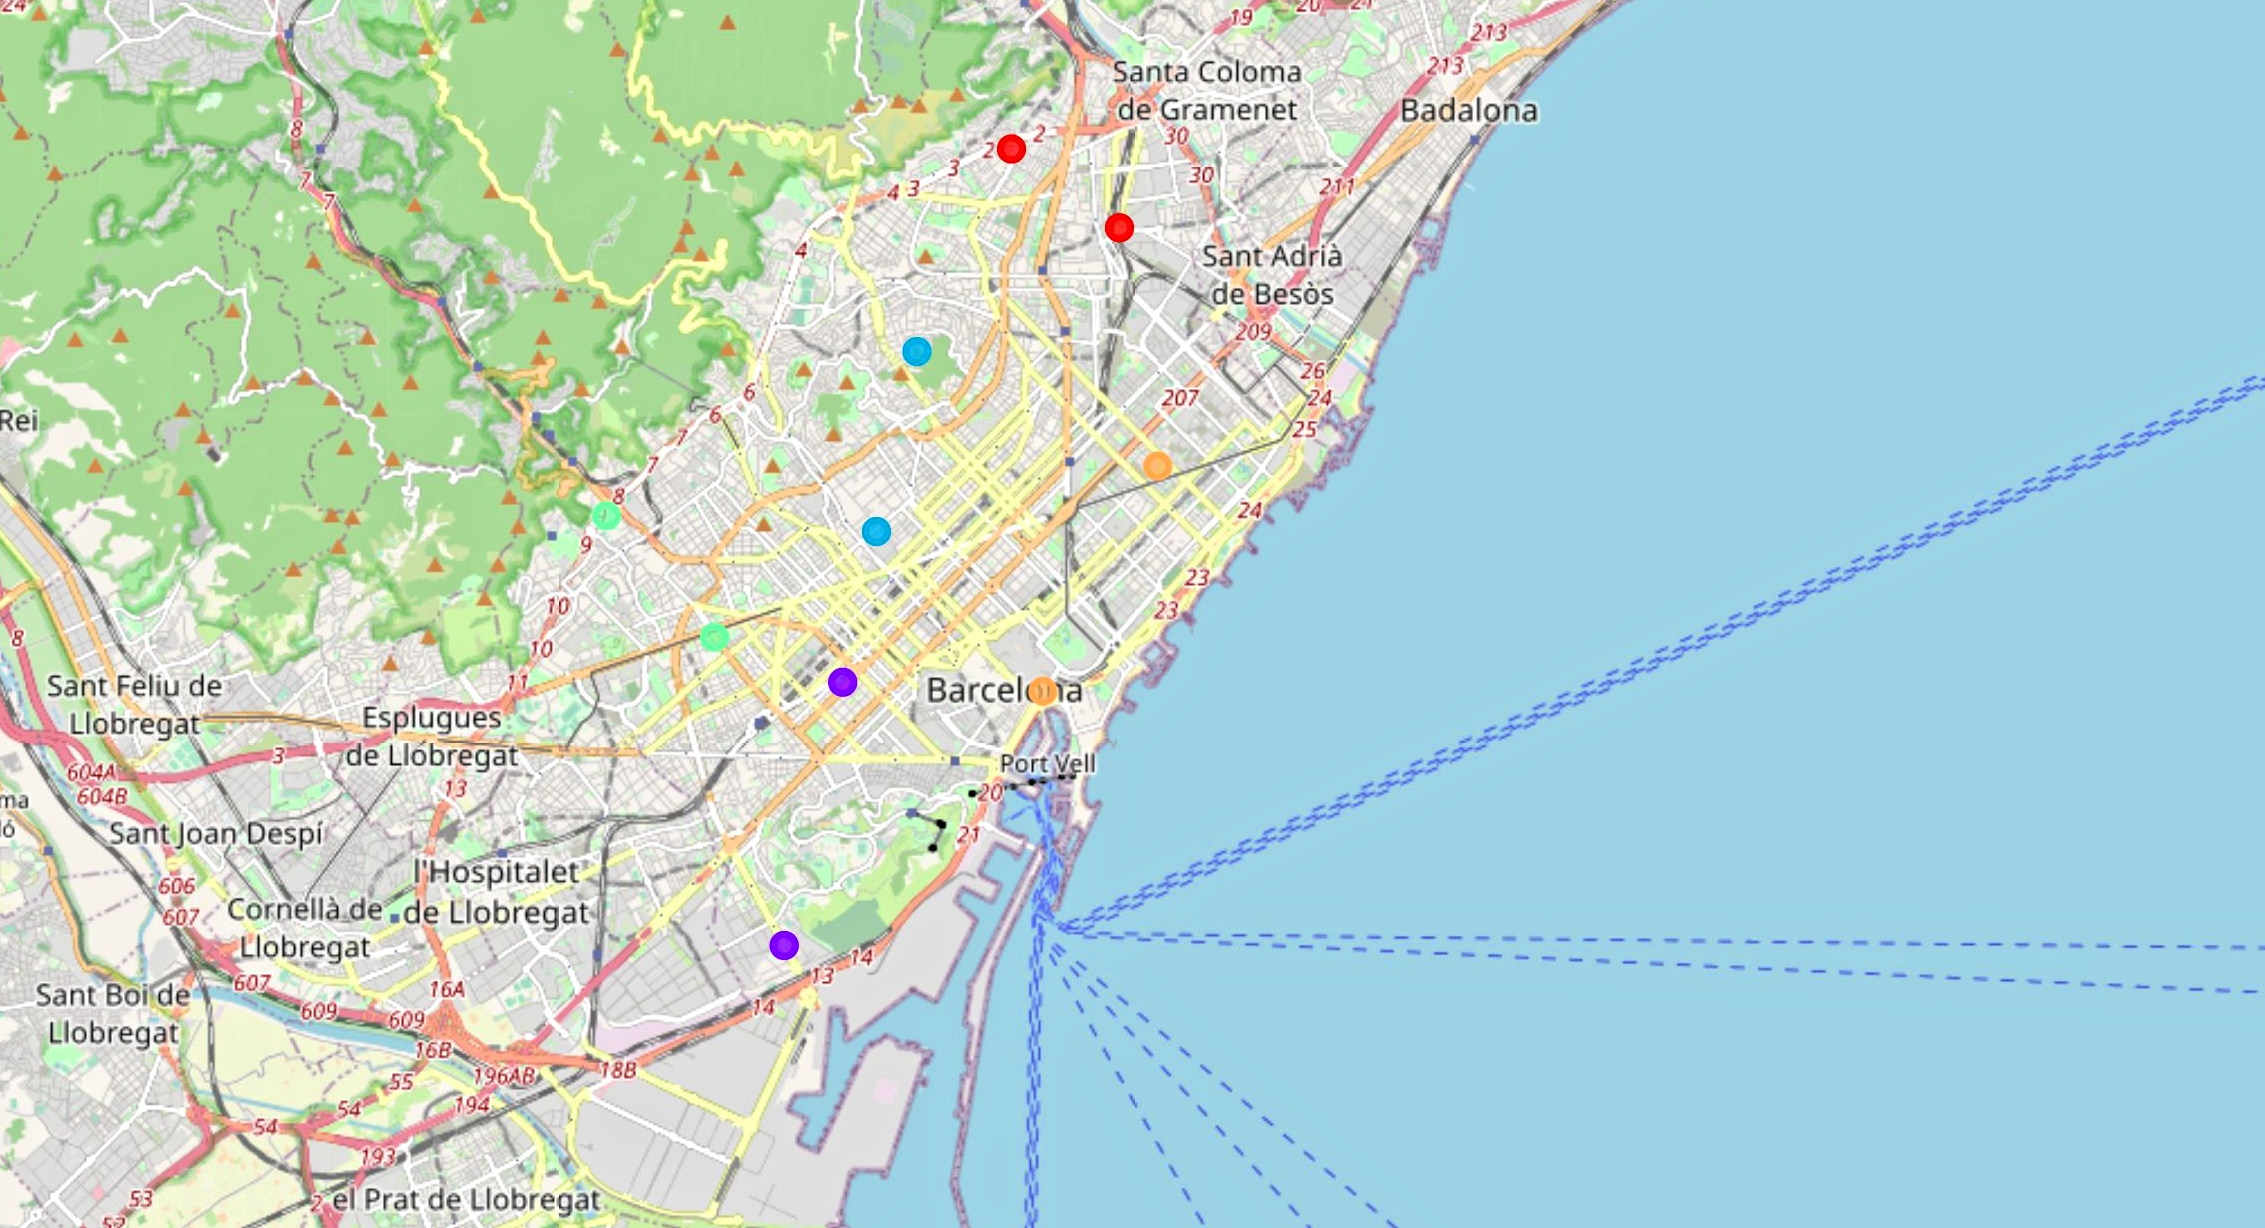
Clustering analysis has limited interest but to show there is no clear specificity of any borough.
4.5. MERGED RESULTS / COMPARATIVE ANALYSIS
We tried to compare the four cities to see whether there was a chance to get a clear view on historic boroughs, or cultural boroughs, or green boroughs. We requested 8 then 7 clusters, and all we got was the four cities split in two clusters each. Only the two ‘historic’ boroughs of Rome were placed in the same cluster than Parisian boroughs when we requested 7 clusters (instead of 8).
We tried again with 4 clusters, to ‘force’ the algorithm to put boroughs from different cities in the same clusters. We got Barcelona and London in the same cluster, Rome in a second cluster except for two ‘historic boroughs’ which were with Paris in a third quarter. The two Paris public parks were in a fourth cluster.
To understand this, let’s visualize the specificities of the cities on a bar chart, based on the 10 most preferred venues for all boroughs of each city:
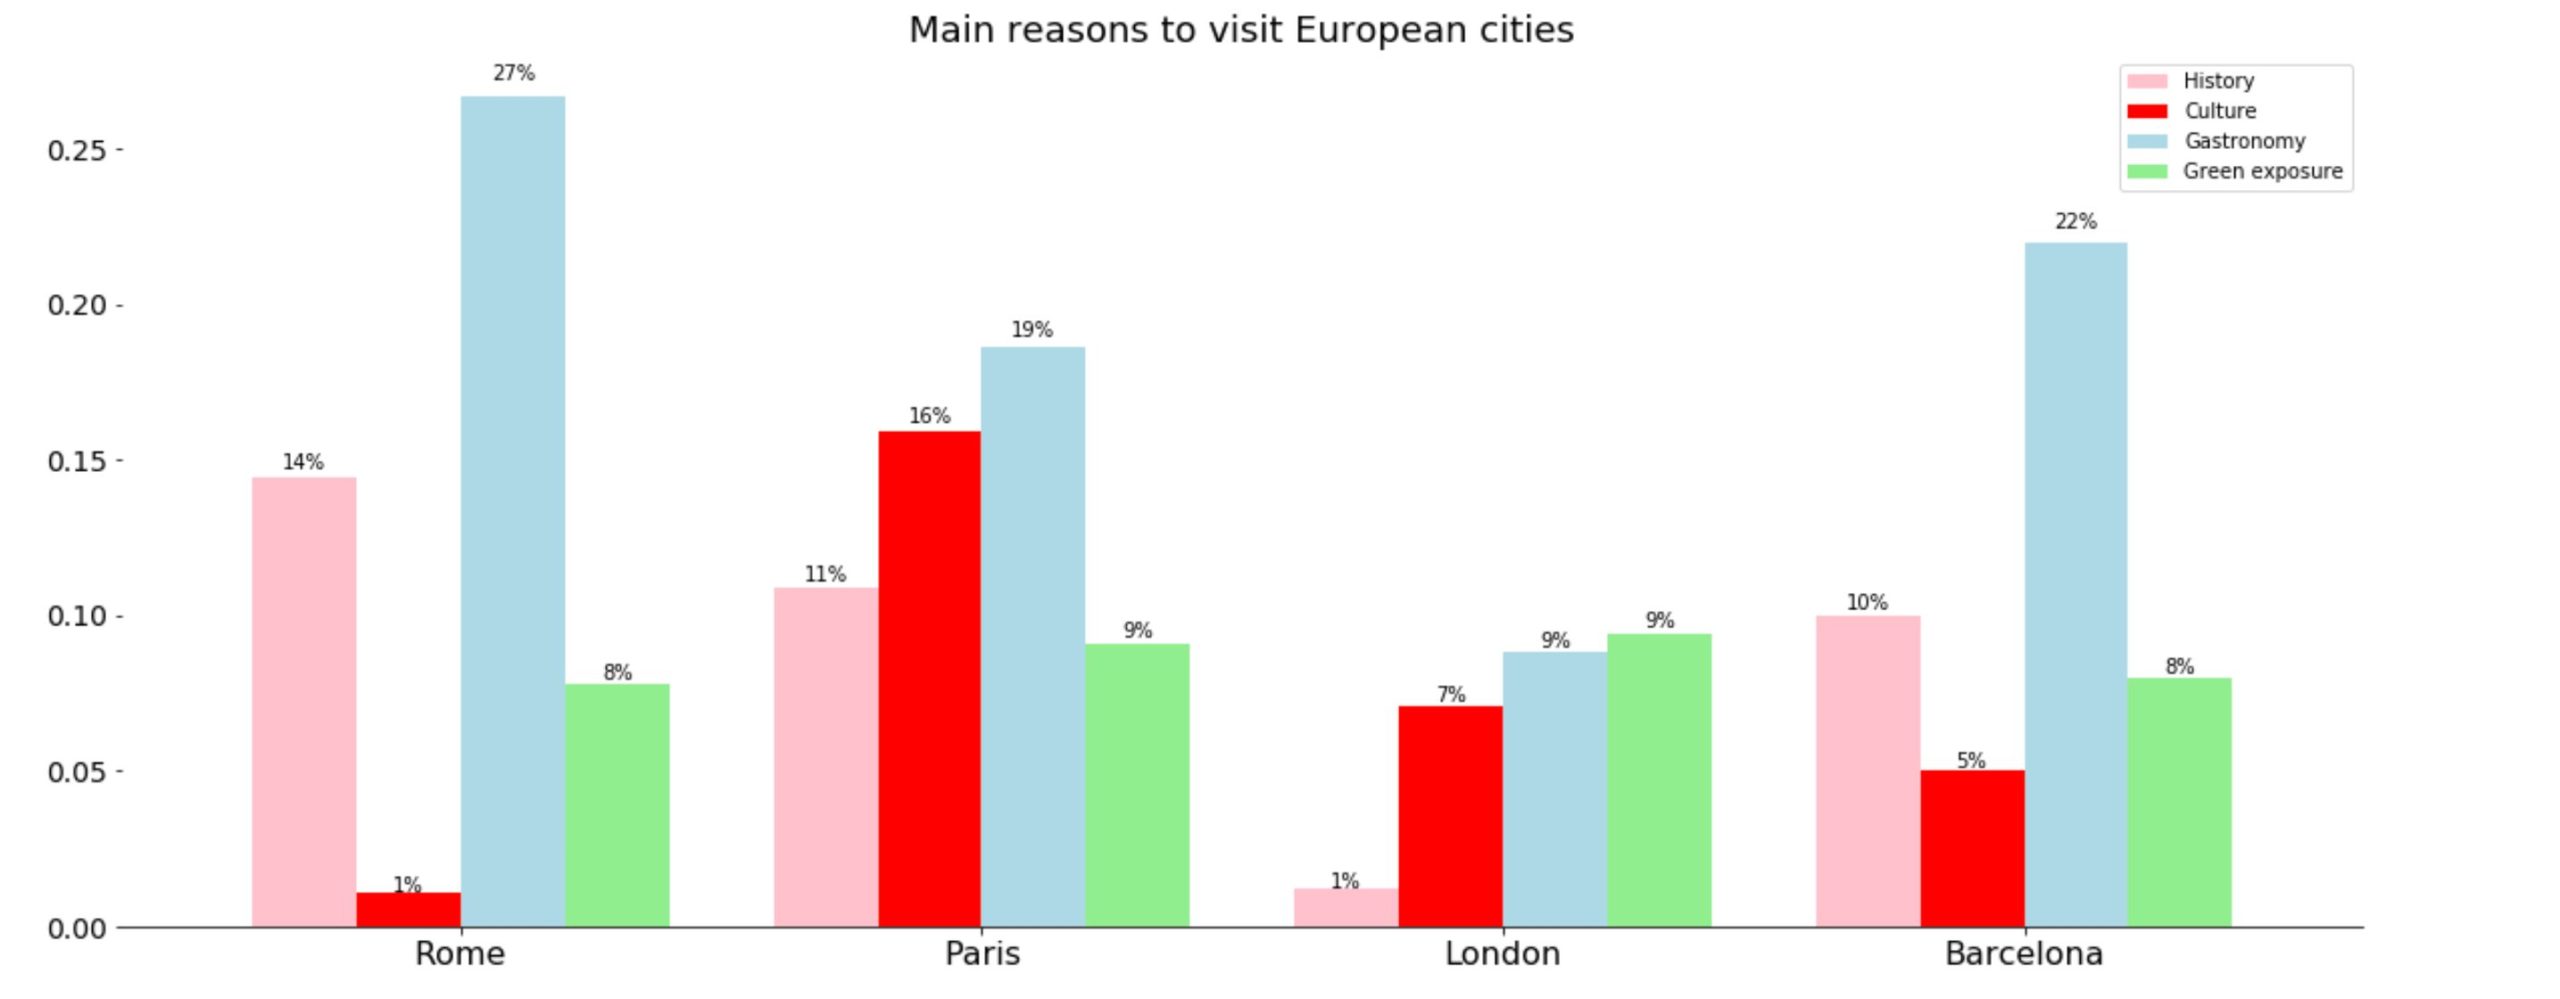
Paris and London have a more balanced range of preferred activities than Barcelona and Rome. But for London, and Barcelona to a lesser extent, the sum of the four percentages is far lower than for Paris and Rome, meaning the very few specific items highlighted in the previous pages explain less of what tourists like in London and Barcelona (respectively 26% and 45%). Is it because tourists are more diverse in these cities?
If we build the same chart with available venues and compare it with the chart above (most preferred), we find out that in some cases, preferences of tourists “exaggerate” the available specifics:
- Rome has low availability of cultural life, and this is almost neglected by tourists; Same for historic venues / monuments in London;
- Paris has mid-level ecotourism but tourists make it look like more important in relative terms; Same for green areas in Paris and Rome, and culture and gastronomy Paris and Barcelona.
5. Discussion
Bar chart above makes us think tourists know what they want when they go to one city or another. They know what to expect and they enjoy it when on site. Further research with FourSquare data may allow determining whether visitors to a single city have a similar profile (Age, nationality, occupation?)
Indeed, our comparison could be easily extended to any city for which FourSquare have venues. It would be interesting to compare European cities with cities from other continents, e.g. North America and Asia. This would help put into perspective what tourists like about European cities vs. other parts of the world.
One should not conclude too quickly about the touristic offer of our cities. The analysis comes from FourSquare users’ posts, which may differ from another application’s users or from tourists that don’t use applications at all. The coverage of FourSquare may also differ from one country to another, as we saw in the total number of venues.
6. Conclusion
It seems that the typical day of a FourSquare tourist is as follows:
- visit historic sites then go for a pizza (and an ice-cream!) in Rome,
- visit plazas and museums, then enjoy the French cuisine and wine in Paris,
- spend a day in a park, then have a beer in a pub before going to the theater in London,
- enjoy a day in a park and have tapas for a meal in Barcelona.
Travel agencies are able to advise their clients on a trip destination based on what they want to experience. Agencies can also advise them on which part of the city they should visit. Agencies can even give them a map with proposed venues, based once again on their expectations.
Have a happy journey!
Leave a Reply