
Do you happen to know that 5% of all male population is actually affected by some form of color-blindness (females are much less prone to it). It means that plenty of activities that tend to rely on color identification by the user is significantly flawed for about 2-3% of the user population. This can become a real issue for companies willing to support equal employment opportunities for all.
In software, if this was not reason enough to think seriously about it, we should also think about the impact of printing onto black & white printers (they are color-blind too and this affect 100% of B&W printer users). Most of the problems could be alleviated by following some simple rules that should be part of any software requirements.
My proposal:
- Color coding is usable provided that you type in the color name inside the colored cell. For example compare the following and what would happen if the colors were missing:
-
-
GreenRedBlue
-
- Think color in shades of grey: Light pink, light yellow and light green will probably be similar; Prefer red, light yellow and dark green (normal, light and dark will print better).
- Use redundant information to complement color information. For example, in colored graphs, lines may be mixing color-coding and dotted-line-coding and other visual cues not relying on color.
- Difficult to print and read:
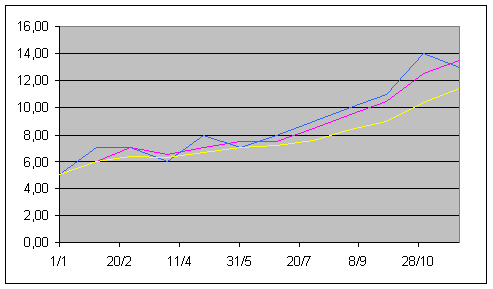
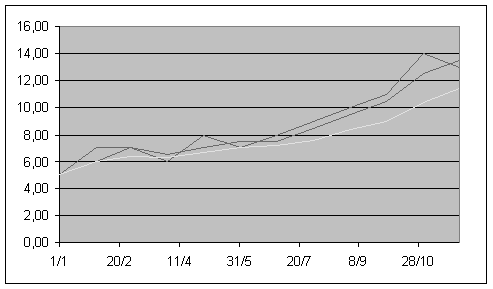
- Better:
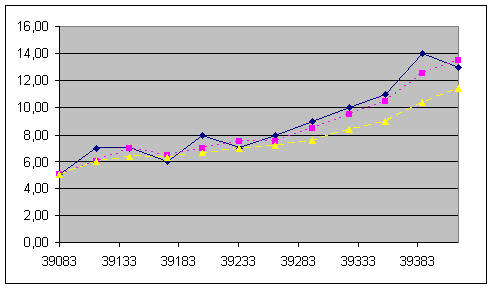
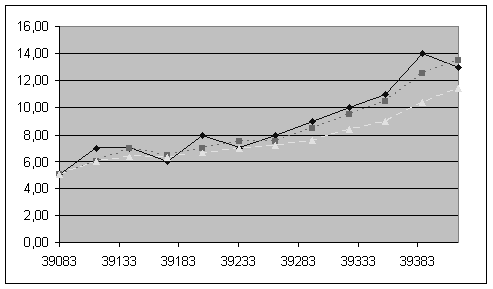
- Difficult to print and read:
- When you test the application (or better when you validate the specification), you should always have a test with a screen used in black & white or shades-of-grey mode. Things that you may not easily notice will quickly pop to your eyes (like in the examples above).
If you start incorporating these in your requirements, your software will be better, your communication will be more efficient (remember that most color-blind people either do not know it or do not tell about it).
And I have seen many people improve significantly this at the individual level just by looking at their own PowerPoint charts or Excel graphs to improve them in a matter of seconds. Why not try it now?
Leave a Reply